
Here you can see the simulation on the screen of the Input and Output LAB values. Each color is represented so you can visually see the difference between them:
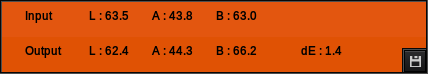
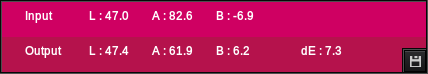
- Input: this is the simulation of the Input LAB values and color.
- Output: this is the simulation of the Output LAB values and color.
- dE: this is the variance between the Input and Output values using the Delta-E method set in the LAB options tab.
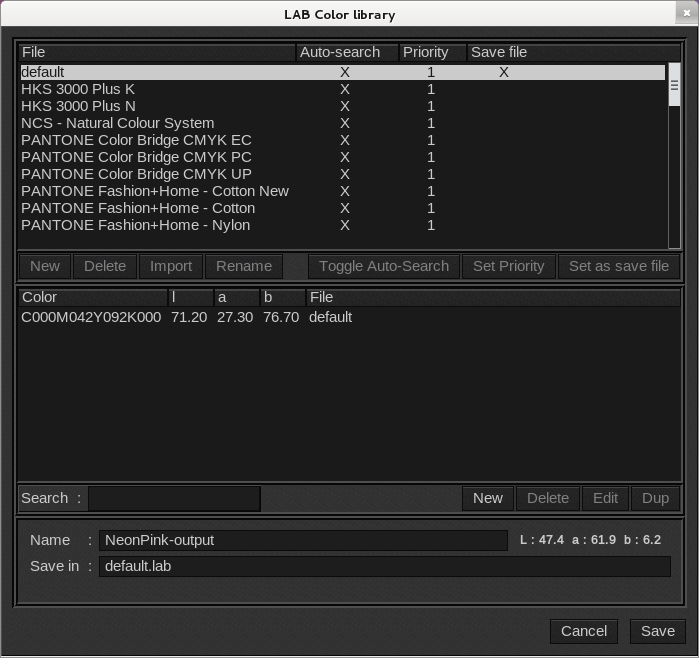
 Save icon: saves the spot color to a library. Enter a name for the spot color and then select a library from the library list. Your spot color will be saved to the library you select. This saves the Output LAB values.
Note: The color is out of the monitor’s gamut when a “!” is displayed. Be cautious when using a simulation of color on a screen. Accurate color reproduction is achieved when your monitor is calibrated and is using a high quality profile. Also the output LAB values are only an estimate and rely on the quality of the output profile for accuracy.